Targeted Buyer Outreach
Direct outreach and source-stamped digital exposure will focus on buyer groups most likely to pursue the property.




Prepared Exclusively for MSCO Corporation
September 2026
Published team performance, laaa.com/track-record, as of September 3, 2026.
Of those closings, 342 are apartment sales covering 4,703 units. CoStar ranked LAAA the most active multifamily team in Los Angeles County from 2019 through 2021, and the team has not finished a quarter without a closed sale since it was founded.
Volume matters here for one reason: it is where the buyer list comes from. The buyer for this property is far more likely to be someone this team has already closed with than someone who finds it on a portal, and a team that closes every quarter is calling those people about something regardless.
• Chairman's Club - Marcus & Millichap's top-tier annual honor
• National Achievement Award - multiple years, both partners
• #1 Most Active Multifamily Team in LA County - CoStar 2019-2021
• Sales Recognition Award - every year since 2016
• 494 closed transactions - $1.56B in sales volume
Our public, continuously maintained reach combines active email subscribers, owner and investor contacts, a building-owner database, and targeted direct buyer calls for each listing.
Direct outreach and source-stamped digital exposure will focus on buyer groups most likely to pursue the property.
Named calls into the local buyer pool, the 1031 exchange buyers who have traded in this size class, and the private capital already holding product in the submarket.
Marcus & Millichap closed 1,415 apartment transactions in the twelve months through Q1 2026, against 778 for CBRE. That is more than the next two firms combined. Over the five years from 2021 through 2025 the firm also ranks first in closed transactions across every property type. What that buys this listing is reach: national distribution, the firm's investor database, and coordination with MMCC on debt terms so a buyer arrives pre-qualified rather than exploring. Ranking source: Marcus & Millichap Research Services, CoStar, Real Capital Analytics and NICMap, 2026.
A property-specific offering site, targeted email, and syndication to the platforms buyers in this market actually search.
Most brokers are reactive. They post the listing, run an email blast, and wait for the phone to ring. We do all of that, and we do it well. Then we do the part almost nobody does. We pick up the phone.
Before your building goes to market, our system builds a probable buyer list for it specifically. It pulls the county assessment record for every property in the surrounding area: who owns it, where their mail goes, what they paid, when they bought, who financed it, and how many other buildings they hold. Out of that come the three groups most likely to buy your building: owners of comparable product nearby, buyers who have closed on buildings like yours recently, and exchange buyers with money that has to be placed on a deadline.
That list runs well over 100 names, and we call every one of them.
Four closed Montrose sales frame the valuation, all within 1.2 miles. Price per unit runs $280,833 to $400,000 and the recommendation sits mid range at $338,235. Price per SF runs $361 to $477 against $422 here, also mid range. Every comp is materially smaller, 6 to 9 units against 17, so the set brackets the per unit and per foot pricing rather than matching operating scale.
This is an income purchase. A full building at 99.3% of potential rent in a foothill submarket with four recent closings inside 1.2 miles offers a buyer predictability rather than upside.
An owner who already holds product in La Crescenta, Montrose or Glendale and wants a full building with no lease up risk and no deferred turn.
An exchange buyer needing a clean, fully occupied asset that closes on schedule, where the diligence risk sits in the physical plant rather than in the rent roll.
Anchor the campaign in verified current operations and supported market evidence.
Gardens at La Crescenta is a 17 unit apartment property at 3000 Honolulu Ave in La Crescenta, held by MSCO Corporation. Two structures sit on a single parcel, APN 5617-007-018, totalling 13,628 gross SF on a 17,616 SF lot, built in 1958.
This is the stabilized half of the portfolio. The building is full, in place rent is within 1% of potential, and the pro forma adds $3,296 of net operating income. Value rests on current income and the Montrose sale evidence rather than on a recovery story.
This is an income purchase. A full building at 99.3% of potential rent in a foothill submarket with four recent closings inside 1.2 miles offers a buyer predictability rather than upside.
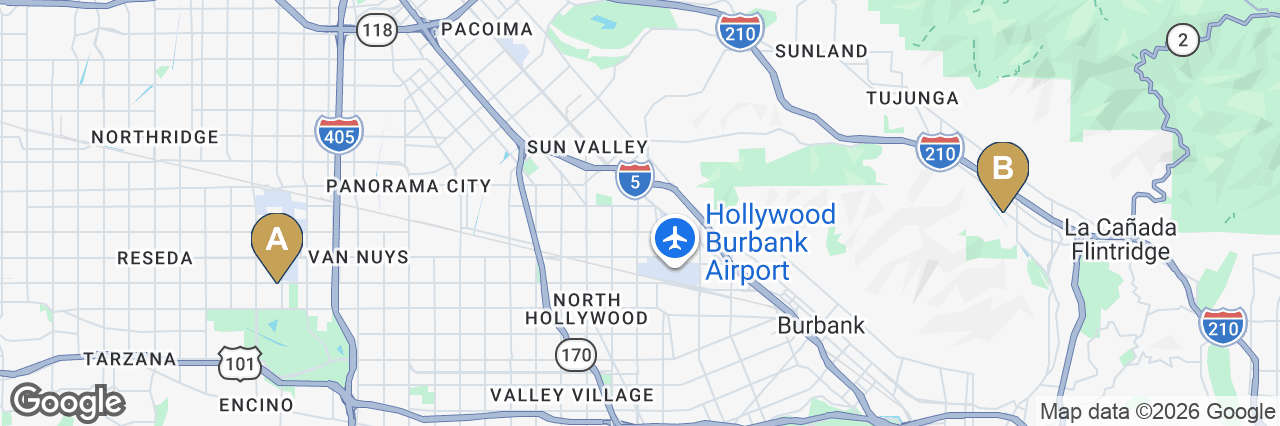
The property sits on Honolulu Ave in La Crescenta, in the foothills above Glendale. All four closed sales framing this valuation are in Montrose, every one of them within 1.2 miles of the building, and the nearest rent comp is a quarter mile away on Montrose Ave.
| Property & Location Details | |
|---|---|
| Address | 3000 Honolulu Ave, La Crescenta, CA 91214 |
| City | La Crescenta, CA 91214 |
| APN | 5617-007-018 |
| Year Built | 1958 |
| Building SF | 13,628 |
| Lot Size | 17,616 SF (0.4 ac) |
| Units | 17 |
| Parking | On-site parking; count to be confirmed from the site inspection. |

| Property Overview | |
|---|---|
| Units | 17 |
| Year Built | 1958 |
| Building SF | 13,628 |
| Lot SF | 17,616 |
| APN | 5617-007-018 |
| Unit Mix | |
|---|---|
| 1x Studio / 1 Bath | 450 (est.) SF |
| 15x 1 Bed / 1 Bath | 800 (est.) SF |
| 1x 2 Bed / 1 Bath | 900 (est.) SF |
Two structures on one lot, 17 units totalling 13,628 gross SF on a 17,616 SF parcel. The mix is 15 one bedroom units, one studio and one two bedroom, averaging 802 SF.
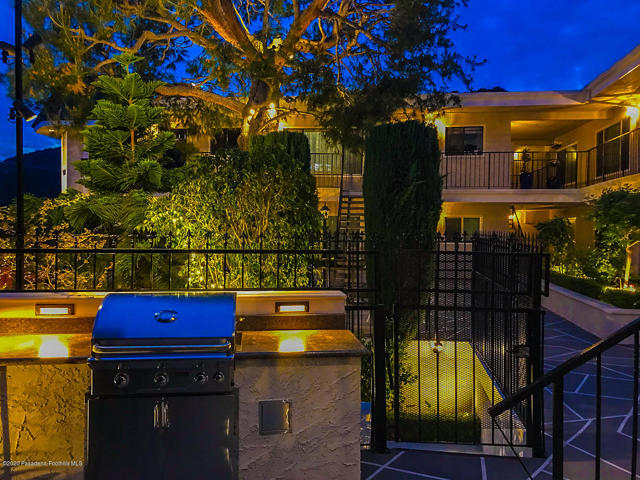
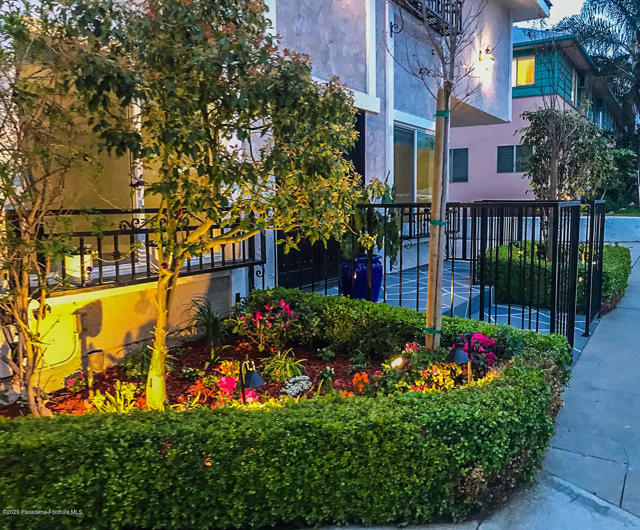
Click any image to enlarge. Images depict the property and representative interiors. Source: listing media and site photography.

| Address | Unit Type | SF | Asking Rent | Distance |
|---|---|---|---|---|
| 1Sunset Ridge at La Crescenta, 2800 Montrose Ave, Glendale, CA 91214, USA | Studio | - | $2,045 | 0.27 mi |
| 2hon272 Apartments, 2722 Honolulu Ave, Montrose, CA 91020, USA | Studio to 1BR | - | $1,948 | 0.37 mi |
| Average (2 comps) | - | $1,996 | 0.32 mi | |
| Address | Unit Type | SF | Asking Rent | Distance |
|---|---|---|---|---|
| 1Sunset Ridge at La Crescenta, 2800 Montrose Ave, Glendale, CA 91214, USA | 1BR | - | $2,230 | 0.27 mi |
| Average (1 comp) | - | $2,230 | 0.27 mi | |
| Address | Unit Type | SF | Asking Rent | Distance |
|---|---|---|---|---|
| 1Sunset Ridge at La Crescenta, 2800 Montrose Ave, Glendale, CA 91214, USA | 2BR | - | $2,800 | 0.27 mi |
| 2hon272 Apartments, 2722 Honolulu Ave, Montrose, CA 91020, USA | 2BR | - | $2,595 | 0.37 mi |
| Average (2 comps) | - | $2,698 | 0.32 mi | |
| Address | Unit Type | SF | Asking Rent | Distance |
|---|---|---|---|---|
| 3Vue at Montrose, 2121 Valderas Dr, Glendale, CA 91208, USA | Mixed | - | $1,800 | 1.48 mi |
| Average (1 comp) | - | $1,800 | 1.48 mi | |
Three competing La Crescenta and Montrose properties frame the rents, all within 1.5 miles. One bedrooms run $1,948 to $2,230 and two bedrooms run $2,595 to $2,800. These are asking rents from listing sources, not signed leases, and they are not represented as achieved subject rents.

| Address | Yr | Units | Bldg SF | Land SF | Sale Price | $/Unit | $/SF | $/Land SF | GRM | Cap | Date |
|---|---|---|---|---|---|---|---|---|---|---|---|
| 1Ocean View Gardens Apartments, 4439 Ocean View Blvd, Montrose, CA 91020, USA | 1962 | 20 | 16,338 | 19,602 | $5,540,000 | $277,000 | $339 | $282.62 | 11.59 | 5.60% | 2026-07-31 |
| 22463 Montrose Ave, Montrose, CA 91020, USA | 1962 | 8 | 7,924 | - | $3,200,000 | $400,000 | $404 | - | - | - | 2025-08-15 |
| 33822 Sunset Ave, Montrose, CA 91020, USA | 1961 | 9 | 8,138 | - | $2,935,000 | $326,111 | $361 | - | - | - | 2026-01-15 |
| 44123 Ocean View Blvd, Montrose, CA 91020, USA | 1948 | 6 | 3,998 | - | $1,685,000 | $280,833 | $421 | - | 12.33 | 5.04% | 2026-03-15 |
| 52218 Mira Vista Ave, Montrose, CA 91020, USA | 1960 | 8 | 5,664 | - | $2,700,000 | $337,500 | $477 | - | - | - | 2025-04-15 |
| Median (5 comps) | 1961 | 8 | 7,924 | 19,602 | $2,935,000 | $326,111 | $404 | $282.62 | 11.96 | 5.32% | - |
Four closed Montrose sales frame the valuation, all within 1.2 miles. Price per unit runs $280,833 to $400,000 and the recommendation sits mid range at $338,235. Price per SF runs $361 to $477 against $422 here, also mid range. Every comp is materially smaller, 6 to 9 units against 17, so the set brackets the per unit and per foot pricing rather than matching operating scale.
1. Ocean View Gardens Apartments, 4439 Ocean View Blvd, Montrose, CA 91020, USA - Closest comparable in the set on unit count, price, vintage and unit size, and the most recent close. Carries a transaction-supported cap and GRM. 20 units against the subject's 17, the closest unit count in the set.; 16,338 SF against 13,628, and 0.45 acres against 0.40.; Average unit 817 SF against the subject's 802, effectively the same unit size.; Built 1962 against 1958. Sold by Marcus & Millichap.; Closed 31 July 2026, the most recent sale in the set, after 93 days on market.; Achieves about $1,992 per unit per month against the subject's $2,624, so the subject earns roughly 32% more per unit on effectively the same unit size.; Capital work completed before the sale included a seismic retrofit, an updated main electrical panel and mostly copper supply lines. On-site laundry adds income.; The seller's marketing materials stated that only six properties of 20 or more units traded in the surrounding corridor over the prior 20 years. Recorded as the seller's claim, not verified by LAAA.
2. 2463 Montrose Ave, Montrose, CA 91020, USA - Closest comp to the subject at seven tenths of a mile, and the nearest on vintage. 8 units against 17.; Average unit 991 SF against the subject's 802 SF. Closed August 2025.; No income detail available in the comp file.
3. 3822 Sunset Ave, Montrose, CA 91020, USA - Nearest match on unit count and vintage, and the second most recent close. 9 units against 17.; Average unit 904 SF against the subject's 802 SF. Closed January 2026.; No income detail available in the comp file.
4. 4123 Ocean View Blvd, Montrose, CA 91020, USA - Most recent close in the set and the only one carrying income detail, but the smallest and oldest. 6 units against 17, and the oldest at 1948.; Average unit 666 SF against the subject's 802 SF. Sold by the LAAA Team of Marcus & Millichap. The transaction appears in the team's published track record at laaa.com/track-record, 6 units at $1,685,000, closed 2026.; Closed March 2026, the most recent in the set.
5. 2218 Mira Vista Ave, Montrose, CA 91020, USA - Similar vintage and unit count, but the oldest sale and the highest price per SF in the set. 8 units against 17.; Average unit 708 SF against the subject's 802 SF. Closed April 2025, the oldest in the set.; No income detail available in the comp file.
| Basis | Price | $/Unit | $/SF | GRM Current | GRM Pro Forma | Cap Current | Cap Pro Forma |
|---|---|---|---|---|---|---|---|
| Suggested list price | $5,750,000 | $338,235 | $421.93 | 10.74 | 10.67 | 5.73% | 5.78% |
| Range top | $5,950,000 | $350,000 | $436.60 | 11.12 | 11.04 | 5.49% | 5.55% |
| Midpoint | $5,750,000 | $338,235 | $421.93 | 10.74 | 10.67 | 5.73% | 5.78% |
| Range bottom | $5,550,000 | $326,471 | $407.25 | 10.37 | 10.30 | 5.98% | 6.04% |
Property taxes reassess at the sale price, so the net operating income and therefore the capitalization rate are recalculated at every rung above.
| Units | Type | Approx SF | Current Rent | Current Monthly | Market Rent | Market Monthly |
|---|---|---|---|---|---|---|
| 1 | Studio / 1 Bath | 450 (est.) | $2,205 | $2,205 | $2,100 | $2,100 |
| 15 | 1 Bed / 1 Bath | 800 (est.) | $2,653 | $39,800 | $2,687 | $40,300 |
| 1 | 2 Bed / 1 Bath | 900 (est.) | $2,600 | $2,600 | $2,500 | $2,500 |
| Total Scheduled Rent | $2,624 | $44,605 | $2,641 | $44,900 | ||
| Additional Income[1] | - | $0 | - | $0 | ||
| Monthly Scheduled Gross Income | - | $44,605 | - | $44,900 | ||
| Current | Market | |
|---|---|---|
| Scheduled Gross Income[2] | $535,260 | $538,800 |
| Vacancy Reserve at 3.0% | ($16,058) | ($16,164) |
| Gross Operating Income | $519,202 | $522,636 |
| Operating Expenses | ($189,919) | ($190,056) |
| Net Operating Income | $329,284 | $332,580 |
| Current | Pro Forma | |
|---|---|---|
| Contract Services[3] | $6,800 | $6,800 |
| General Administrative[4] | $2,550 | $2,550 |
| Insurance[5] | $16,150 | $16,150 |
| Management Fee[6] | $20,768 | $20,768 |
| Manager[7] | $24,000 | $24,000 |
| Repairs Maintenance[8] | $17,000 | $17,000 |
| Reserves[9] | $3,400 | $3,400 |
| Taxes[10] | $70,438 | $70,438 |
| Utilities[11] | $28,813 | $28,813 |
| Underwriting Expense Adjustment[12] | $0 | $138 |
| Total Operating Expenses | $189,919 | $190,056 |
| Expense Ratio | 36.6% | 36.4% |
| Per Unit | $11,172 | $11,180 |
| Per Square Foot | $13.94 | $13.95 |
[1] Additional Income: No additional income is carried; the model shows none for this property.
[2] Scheduled Gross Income: In-place scheduled rent from the model's Rent Roll Summary, $535,260.48, which ties to the August 2026 rent roll in-place sum to the cent. Gross Potential Rent is $538,800, a Loss to Lease of $3,540.
[3] Contract Services: Landscaping, pest control and recurring service contracts, carried from the model.
[4] General Administrative: Accounting, legal, bank fees and licences, carried from the model.
[5] Insurance: Carried from the model at the property's underwritten premium.
[6] Management Fee: Carried at 4.00% of Gross Scheduled Rent, the LAAA standard rate.
[7] Manager: On-site manager carried at $24,000. California requires a manager in residence at 16 units or more, and this building has 17.
[8] Repairs Maintenance: Carried from the model.
[9] Reserves: Replacement reserves, carried from the model. Lenders require a reserve line in underwriting.
[10] Taxes: Reassessed to the recommended price at 1.225%, the rate implied by the model's tax line of $70,437.50. Flat direct assessments are carried at zero because the itemized bill is not in the deal folder, which is the documented treatment when the itemization cannot be read.
[11] Utilities: Owner-paid utilities and trash, carried from the model.
[12] Underwriting Expense Adjustment: Aggregate difference between classified T12 expense lines and the modeled current and pro forma operating expense totals.
Owner-reported figures are unaudited. A buyer should verify all income and expenses in due diligence.
| Operating Data | |
|---|---|
| Price | $5,750,000 |
| Number of Units | 17 |
| Price per Unit | $338,235 |
| Price per SF | $421.93 |
| Current GRM | 10.74 |
| Market GRM | 10.67 |
| Current Cap Rate (LAAA calculation: current NOI / recommended value) | 5.73% |
| Market Cap Rate (LAAA calculation: market NOI / recommended value) | 5.78% |
| Acquisition Structure | |
|---|---|
| Structure | All Cash |
| Equity Required | $5,750,000 |
$5,750,000, or $338,235 per unit and $422 per SF. That is a 5.73% cap on current net operating income of $329,284 and a 10.74 gross rent multiplier on in place rent of $535,260. Operating expenses run 36.58% of effective gross income. The recommended range is $5,550,000 to $5,950,000.
Supported value range: $5,550,000 to $5,950,000
An on site manager is carried at $24,000, as California requires for a building of 16 units or more. Real estate taxes are reassessed to the recommended price.
The rent control regime is not concluded in this report. The assessor record returns a postal city of Glendale for APN 5617-007-018 while the property is identified as La Crescenta. The City of Glendale ordinance and the Los Angeles County ordinance are different regimes, and the answer should be confirmed before it is relied on. The California Tenant Protection Act applies on building age under either.